

It is highly probable that the data stored in financial systems and other platforms can be considered as a treasure trove. However, many businesses are not fully utilizing this valuable asset.
Modern business intelligence (BI) tools can change that. They allow leaders to identify insights and trends in their data that can lead to a number of business opportunities. Their business decisions can then be based on better information.
Business insight tools have become easier to use in recent years, allowing users to generate their own reports without having to be technical wizards or data science gurus. Executives can gain insight whenever they need it since no coding is required.
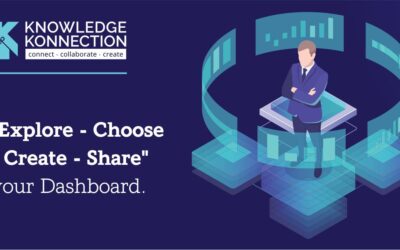
The visualisation of data
The real power of these tools is that they allow your decision-makers to see graphical representations of their data, usually in reports or dashboards. These visualizations make it easier for people to see trends and understand the implications of the numbers than they would be looking at rows of figures.
A BI tool today allows users to create reports and dashboards based on pre-built, fully customizable data models. It’s easy to turn your profit and loss ledger into a dashboard featuring a series of tables, graphs, and standout figures using just a few clicks. Your financial software always updates the data, since it comes from there.
Visualizing trends in your financial data allows you to identify problems before they become serious issues and identify opportunities before they pass you by. Different companies of different sizes and in different sectors use different dashboards and reports.
An overview of the business
A dashboard like this gives you a visual overview of the progress your business is making in terms of generating sales, controlling expenses, and generating profits. Your business can determine trends for future decisions based on whether or not it has made or lost money during the period under review.
Graphs showing sales trends
Seeing that your revenue is rising or falling isn’t sufficient by itself for you to take action. You can track sales trends month over month or year over year with a sales trend analysis dashboard, which breaks down sales by region, salesperson, customer, or estimate. You can use this information to determine where to invest or where to deploy sales resources for optimal growth.
Being financially responsible
The cash flow of a business that wants to succeed and survive must be monitored. You can use analysis dashboards to see who owes you cash, how much, and when you can expect to receive it.
Utilizing your data to its full potential
Businesses generate a great deal of data today, and BI enables you to make sense of that data and drive business value. Efficiencies range from basic efficiencies to the ability to gain insights leading to a competitive advantage. With technology today, implementing efficiencies is a simple process.
Read more: 10 Ways To Use Business Intelligence For Your Company


Recent Comments